Understanding the Bitcoin "Death Cross" and What Comes Next

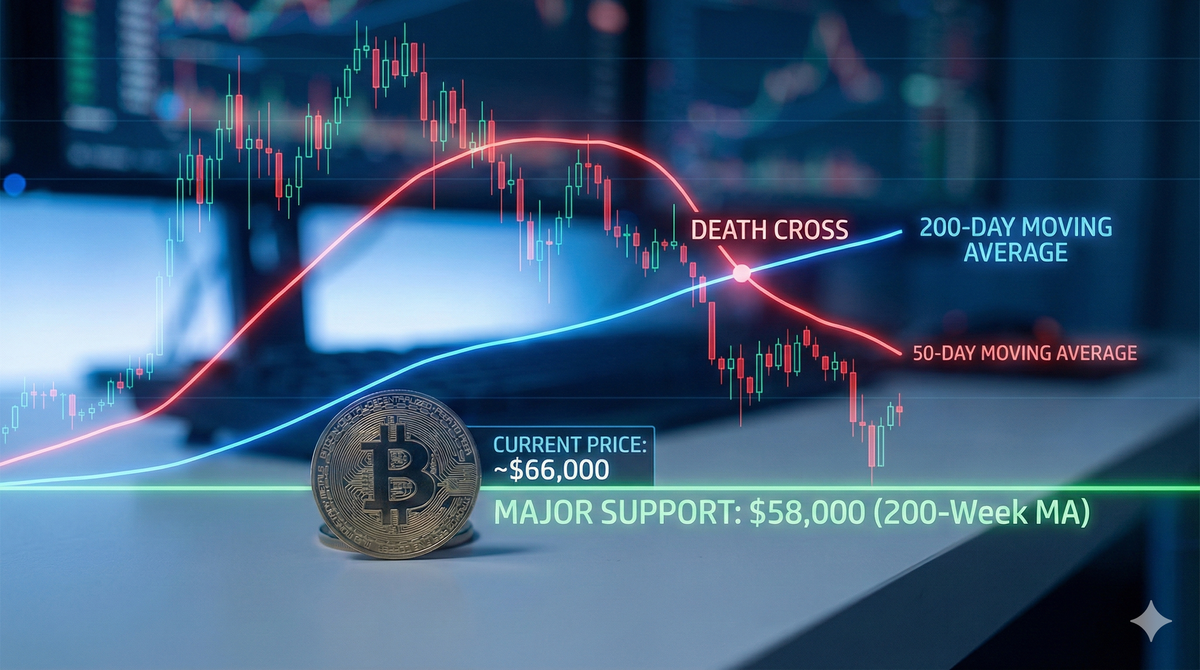
Bitcoin is currently facing one of its toughest moments in recent months, trading around $64,000. To the casual observer, this price might still seem high, but for analysts who study market trends, the picture looks a bit gloomy. The most concerning signal is that the price is sitting far below its 200-day moving average, which is currently up near $97,000. In simple terms, this average acts like a health check for the market. When the price is above it, the market is healthy and growing; when the price is deeply below it, as it is now, it suggests that the long-term trend has turned downward and sellers are in control.
To make matters more tense, the market recently confirmed a pattern known ominously as a "Death Cross." While the name sounds dramatic, the concept is quite simple. It happens when the short-term average of Bitcoin’s price drops below its long-term average. Think of it like a runner losing momentum; their sprint speed has become slower than their jogging speed, indicating they are getting tired. For investors, this cross is a psychological red flag, often causing large institutions to sell some of their holdings to protect against further losses, which in turn pushes the price down even more.
The big question everyone is asking is where the falling price will finally stop.
Right now, all eyes are fixed on the $58,000 level. This specific number isn't random; it represents the "200-week moving average," a line on the chart that traces Bitcoin's average price over the last four years. Historically, this line has acted as the ultimate safety net. In previous years when the market crashed, this long-term average was often the solid floor where the price stopped falling and began to recover. It is the "line in the sand" that separates a standard correction from a much deeper, multi-year bear market.
However, even if Bitcoin hits this $58,000 safety net and bounces back up, the road to recovery will likely be bumpy. The market recently lost a key support level at $68,000, and in the world of trading, a broken floor often becomes a new ceiling. This means that if the price tries to rally back up, it will likely struggle to get past $68,000. Traders who bought at that level and are currently losing money may look to sell as soon as the price returns to break even, creating a wave of selling pressure that could keep a lid on any excitement.
For the average investor, the best strategy in this environment is usually patience rather than panic. The market is currently trying to decide if $58,000 is a rock-solid bottom or just a temporary pause. Instead of trying to guess the exact moment the price will turn around, savvy investors often wait for the dust to settle. Watching to see if the price can hold steady at that $58,000 level for a few weeks is often safer than trying to catch a falling knife. The trend is currently down, but history shows that these major support levels are where the most significant opportunities eventually form.